
The Tale of Two Sharing Economy Giants
Uber Technologies and Airbnb have emerged as the two dominant platforms reshaping their respective industries, yet their financial trajectories have diverged sharply in recent years. While both companies revolutionized transportation and hospitality respectively, Uber is now demonstrating substantially stronger financial performance, commanding lower valuations and delivering steadier revenue growth. The gap between these mobility and lodging titans has widened dramatically—from $11.4 billion in 2021 to nearly $40 billion in 2025—a telling indicator of how differently investors are rewarding each platform's business model and execution.
This divergence presents a compelling case study for investors seeking to understand how business model resilience, operational efficiency, and market dynamics shape shareholder value creation in the digital economy.
Key Details: The Numbers Tell the Story
The financial metrics paint a striking picture of competitive advantage favoring $UBER:
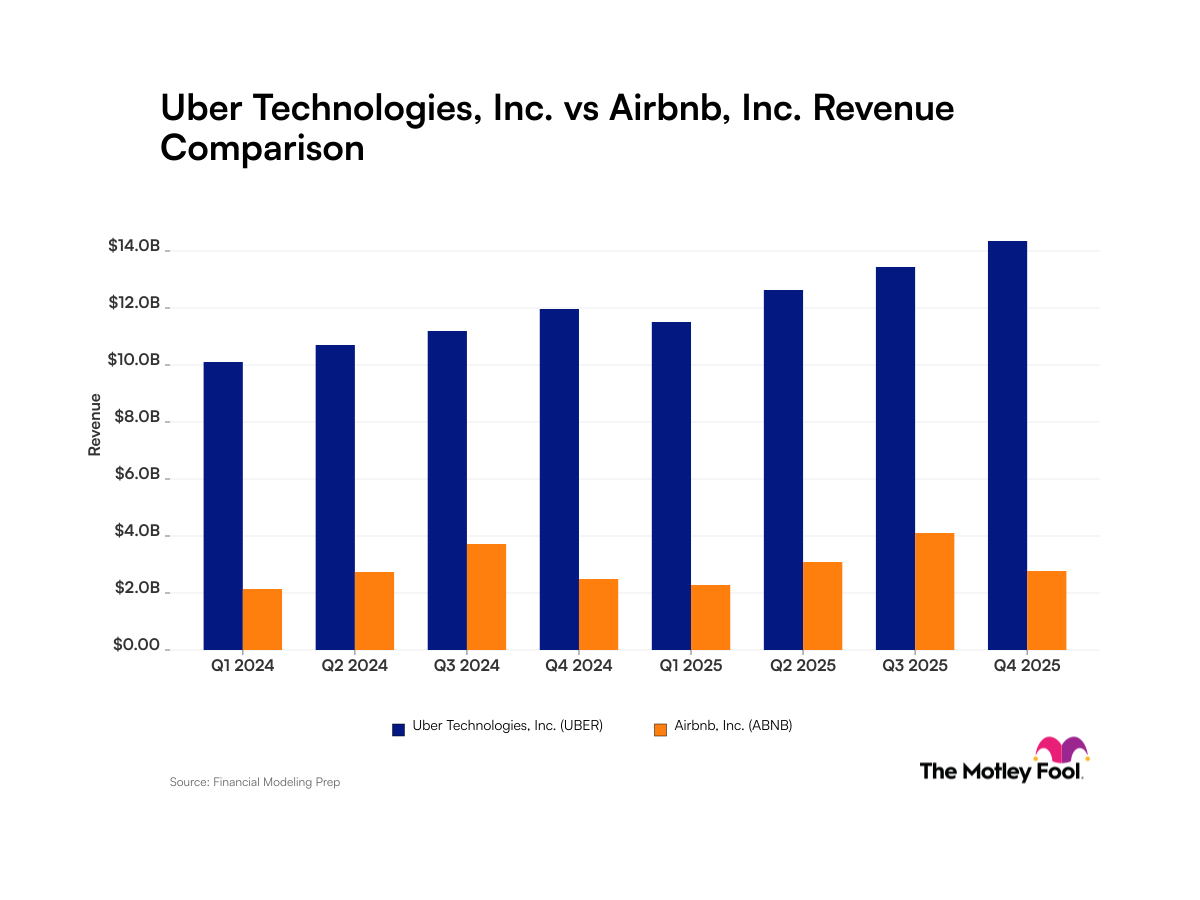
Revenue Growth Momentum:
- Uber: Approximately 20% year-over-year revenue growth
- Airbnb: Approximately 10% year-over-year revenue growth
- The revenue differential has expanded from $11.4 billion in 2021 to nearly $40 billion in 2025—a 250%+ increase in the gap
Valuation Multiples (Critical Investor Metric):
- Uber Price-to-Sales (P/S): 2.9x
- Airbnb Price-to-Sales (P/S): 6.6x (more than double Uber's multiple)
- Uber Price-to-Earnings (P/E): 15.3x
- Airbnb Price-to-Earnings (P/E): 32.3x (more than double Uber's multiple)
These valuation disparities are particularly significant. Airbnb trades at a substantial premium despite slower growth, suggesting investors have priced in execution risks or lower long-term growth expectations. Conversely, Uber's lower multiples relative to its superior growth rate indicate the market may be undervaluing the platform's profitability trajectory and scaling advantages.
Seasonality: A Critical Operational Difference:
One of the most important distinctions between these platforms emerges in their revenue patterns:
- Uber: Demonstrates consistent quarter-over-quarter expansion with minimal seasonal fluctuation, reflecting the essential nature of transportation services across all seasons and economic cycles
- Airbnb: Exhibits pronounced seasonal revenue patterns with Q3 peaks, indicating heavy dependence on summer travel and leisure cycles
This seasonality for Airbnb creates quarterly volatility that complicates revenue forecasting and makes the business less predictable for investors and stakeholders. The consistency of Uber's revenue stream provides greater visibility into future financial performance and reduces the risk of unexpected shortfalls.
Market Context: Why These Differences Matter
The diverging trajectories of $UBER and $AIRBNB reflect fundamental differences in their addressable markets and business characteristics:
Market Demand Dynamics:
Urban transportation is a necessity-driven market. People need reliable, affordable transportation regardless of season—commuting to work, running errands, and attending appointments occur year-round. This creates a more stable, recurring revenue base with limited seasonal volatility. Airbnb, by contrast, operates primarily in the leisure and travel segment, where demand spikes during summer vacation periods and winter holidays while declining during off-peak seasons.
Competitive Landscape:
Uber has achieved near-monopolistic status in many markets, with Lyft ($LYFT) representing a distant competitor in ridesharing. Additionally, Uber has successfully diversified into food delivery (Uber Eats) and freight, creating multiple revenue streams that smooth out seasonal variations. Airbnb faces competition from traditional hotel chains, vacation rental platforms, and booking aggregators, with less opportunity for diversification within its core offering.
Operational Efficiency:
The 2x growth differential suggests Uber is operating at superior efficiency, converting incremental revenue into earnings more effectively. This could reflect better unit economics, improved driver acquisition costs, reduced churn, or superior pricing power. The lower P/E multiple despite higher growth suggests investors may doubt Airbnb's ability to maintain current profitability levels, or they expect Uber to sustain its growth advantages.
Regulatory Environment:
Both companies operate in heavily regulated industries. However, Uber's transportation network model has become increasingly accepted globally, with established frameworks in major cities. Airbnb continues facing zoning challenges, local rental restrictions, and taxes in key markets like New York City and Paris, creating structural headwinds to growth.
Investor Implications: What This Means for Your Portfolio
These financial divergences carry significant implications for different investor profiles:
Value Investors:
Uber's combination of superior growth (20% YoY) with lower valuations (2.9x P/S, 15.3x P/E) creates a potentially attractive risk-reward profile. The company is delivering more than double Airbnb's growth rate while trading at less than half its valuation multiples, suggesting potential upside if the market reprices toward growth metrics.
Growth Investors:
The slowdown in Airbnb's growth rate (10% YoY) raises questions about market saturation or execution challenges. The premium valuation multiples leave limited room for positive surprises, making the risk-reward asymmetric. Uber's sustained 20% growth with expansion opportunities in new verticals (freight, advertising) and geographic markets presents more compelling upside potential.
Income & Stability Seekers:
Uber's consistent quarterly performance and lower seasonal volatility make it a more predictable investment. Airbnb's pronounced Q3 peaks mean investors must be prepared for quarterly volatility and potential disappointment in off-peak quarters. This structural difference makes Uber more suitable for conservative portfolios prioritizing stable returns.
Duration Risk:
Airbnb's higher valuation multiples create greater downside risk if growth disappoints or competitive pressures emerge. Trading at 32.3x earnings leaves minimal margin for error. Uber's 15.3x P/E provides more cushion if business conditions deteriorate.
The widening revenue gap—from $11.4 billion in 2021 to $40 billion in 2025—demonstrates that this is not a temporary phenomenon but a structural shift in competitive positioning. Uber is winning in growth, profitability, and arguably in investor confidence.
Looking Forward: The Divergence Likely Continues
The evidence suggests Uber's advantages are structural rather than cyclical. Superior growth combined with lower valuations creates a compelling asymmetry for investors. Airbnb's seasonal revenue patterns, slower growth trajectory, and premium valuation multiples present a less attractive risk-reward profile unless the company can demonstrate a meaningful acceleration in its growth rate or introduce new revenue streams to offset seasonality.
For investors comparing these two sharing economy champions, the choice appears increasingly clear: $UBER offers better growth at better valuations with more predictable revenue patterns, while $AIRBNB offers exposure to the leisure travel recovery at premium multiples with elevated quarterly volatility. The gap between these platforms will likely remain a key indicator of broader market sentiment toward essential services versus discretionary consumption.